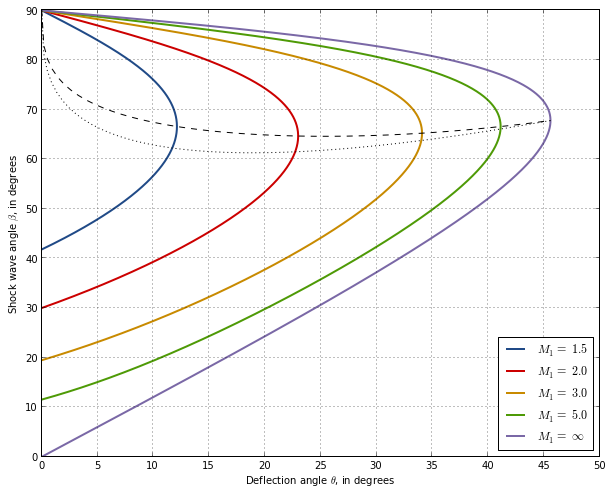
Oblique shocks chart
Draws a chart displaying the possible combinations of deflection and shock wave angle for several values of incident Mach number. Similar to http://en.wikipedia.org/wiki/File:ObliqueShockAngleRelation.png
[1]:
%pylab inline

import numpy as np
import scipy as sp
import scipy.optimize
import matplotlib.pyplot as plt

from skaero.gasdynamics import shocks
Welcome to pylab, a matplotlib-based Python environment [backend: module://IPython.zmq.pylab.backend_inline].
For more information, type 'help(pylab)'.
[2]:
def plot_shock_curve(M_1, ax=None, N=1001, gamma=1.4, *args, **kwargs):
    """Plots curve corresponding to oblique shocks with given M_1.

    Uses degrees as default unit.

    """
    if not ax:
        ax = plt.gca()
    mu = np.arcsin(1.0 / M_1)
    beta = np.linspace(mu, np.pi / 2, N)
    theta = np.zeros_like(beta)
    for i in range(N):
        theta[i] = shocks.Shock(M_1=M_1, beta=beta[i], gamma=gamma).theta
    ax.plot(np.degrees(theta), np.degrees(beta), label=r"$M_1 = \,{}$".format(M if np.isfinite(M) else "\infty"), *args, **kwargs)
[3]:
def plot_max_line(ax=None, N=1001, gamma=1.4, *args, **kwargs):
    """Plots line of maximum deflection angles.

    Uses degrees as default unit.

    """
    if not ax:
        ax = plt.gca()
    M = np.logspace(0, 10, N)
    theta_max = np.empty_like(M)
    beta_max = np.empty_like(M)
    for i in range(N):
        theta_max[i], beta_max[i] = shocks.max_deflection(M[i], gamma)
    ax.plot(np.degrees(theta_max), np.degrees(beta_max), *args, **kwargs)
[4]:
def plot_sonic_line(ax=None, N=1001, gamma=1.4, *args, **kwargs):
    """Prints line separating supersonic from subsonic flow behind the shock.

    Uses degrees as default unit.

    """
    if not ax:
        ax = plt.gca()
    M = np.logspace(0, 10, N)
    theta_sonic = np.empty_like(M)
    beta_sonic = np.empty_like(M)
    def eq(beta, M_1, gamma):
        os = shocks.Shock(M_1=M_1, beta=beta, gamma=gamma)
        return os.M_2 - 1
    for i in range(N):
        mu = np.arcsin(1.0 / M[i])
        __, beta_max = shocks.max_deflection(M[i], gamma)
        beta_sonic[i] = sp.optimize.bisect(eq, mu, beta_max, args=(M[i], gamma))
        theta_sonic[i] = shocks.Shock(M_1=M[i], beta=beta_sonic[i], gamma=gamma).theta
    ax.plot(np.degrees(theta_sonic), np.degrees(beta_sonic), *args, **kwargs)
[5]:
# Creates and fills the final figure
fig = plt.figure(figsize=(10, 8))
ax = fig.add_subplot(111)

M_list = [1.5, 2.0, 3.0, 5.0, np.inf]
gamma = 1.4
for M in M_list:
    plot_shock_curve(M, gamma=gamma, linewidth=2)

plot_max_line(gamma=gamma, color='k', linestyle='--')
plot_sonic_line(gamma=gamma, color='k', linestyle=':')

ax.grid(True)
ax.set_ylim(0, 90)
ax.set_xlim(0, 50)
ax.set_xticks(np.arange(11) * 5)
ax.set_xlabel(r"Deflection angle $\theta$, in degrees")
ax.set_ylabel(r"Shock wave angle $\beta$, in degrees")
ax.legend(loc=4)

fig.savefig("oblique_shock_graph.png", bbox_inches="tight", dpi=100)
[5]: